Beralih ke Microsoft project server , mengapakah?
Bila anda sudah terbiasa dgn microsoft project ( msp) dan ditempat anda simultant ada byk projects , tak pelak anda butuh lebih utk bisa optimization.
Program atau porfolio mgt dibutuhkan utk menata lbh baik , lbh baik menuju arah perusahaan terdepan :
Project interdependecies,
Resolve Common problems, masalah klasik: resource, utilization , cost dll.
Lalu apa yg bisa kita ambil lebih dr msp server,?
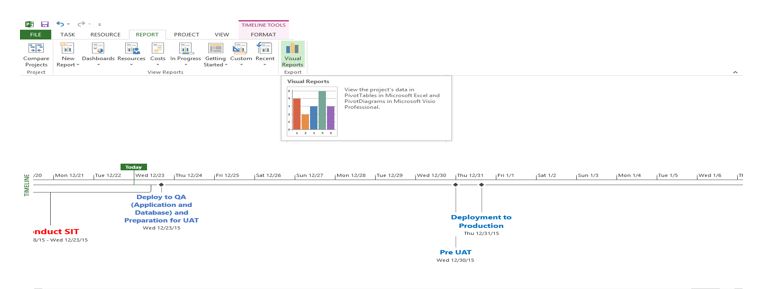
Pertama anda bisa membuat dashboard report yg lbh cepat, anda bisa atur merah utk below, hijau utk above bisa schedule, cost tcpi misalnya, dll
Konsep dasar dr msp server adalah:
PM create project schedule, save publish to server, assigned global resources.
Resources beserta rate cost bisa di maintainance dr hr , sap misalnya.
Setiap resources yg diassign py akses ke project schedule tsb,
Confirmasi completed status dr tasks diproject tsb.
Status akan dilihat oleh pm utk projec ini.
Dr sisi management akan melihat lbh cepat utk semua result status update dr semua project. Percentage completed misalnya.
Decision bisa sgr diambil, utk peningkatan yg dibuthkan.
Minusny diatas ada prlu tambahan license, utk cost saving PM bisa mewakilkan utk melakukan konfirmasi task.
Lalu apa kelebihan lain,
Krn terintegrasi, resource bisa dr satu sumber,valid rate,nama, role yg lbh update drpd assign manual.
Status report, bisa anda create bisa misalnya weekly: anda isi highlight, next task, dll anda bisa customize.
Repository docs,
Semua project dokument bisa anda simpan terpusat dan bisa dijadikan check list utk project governance dr misal proposal, charter, mom dlll dll
Issue dan risk bisa digenerate.
Automatically alert reminder by email, sfb atau lync.
Timesheet.
Microsoft Project server business intelligence, keren ya wkk.
the PMO Architecture Layer:
- A Project Portfolio Management (PPM) Application
- Microsoft Project Server, HP/Mercury ITG, CA/Niku Clarity, Planview, SaaS Appls, etc.
- Desktop Tools supporting the PMO and/or PPM Application
- Microsoft Project Professional, Open Workbench, etc.
- A Collaboration and Document Management Platform (Teamsites, Workspaces, eRooms, etc.)
- Microsoft SharePoint, IBM Lotus, Documentum, etc.
- PMO Content Assets (Processes, Templates, Policies, SME Knowledge, Executive Dashboards, etc.)
- BOT Processes On Demand, PM Solutions PMCoP, Tensteps, etc.
Top 10 Tips for Microsoft Project Server
Tip 1: Valuable, but not a simple tool. Microsoft Project Server is an extremely valuable application for companies seeking to engage in enterprise project management and project team collaboration. However, Project Server is not a simple tool, even for those who have used Project Server before and have experience using Microsoft Project Professional. Ensure adequate administrator and user training when implementing Project Server.
Tip 2: The difference between saving and publishing. There is a difference between saving and publishing your project to Project Server. When you are working on a project plan, you will want to save your project from time to time to protect against losing your work. However, you may not have finalized your project plan and want to continue to add information to it, review it, and/or modify it before publishing. Therefore, you save it first, and publish your project only when you believe that it contains enough information that will make it useful to other viewers of the project plan on Project Server.
Tip 3: Enterprise projects. A project is an enterprise project when you create the project schedule using Microsoft Project Professional while connected to Project Server with Enterprise Features enabled and you import the project to the enterprise using the Import Project to Enterprise wizard. In a Project Server environment, no other non-programmatic method of creating an enterprise project is possible because all projects are stored in the Project Server database.
Tip 4: Enterprise resources. A resource is an enterprise resource when it is either created in the Enterprise Resource Pool using the Microsoft Project Professional client while connected to Project Server with Enterprise Features enabled or when the resource is imported into the Enterprise Resource Pool using the Import Resource to Enterprise Wizard in Microsoft Project Professional. Resources that exist in local projects, but not the Enterprise Resource Pool, are termed a local resource, meaning that it is local to the project only.
Tip 5: Enterprise resource pool. The centralized enterprise resource pool is key and required in order to implement the advanced resource management functionality in Project Server. The resource pool contains resources and attributions that drive functionality like matching people to tasks. After you complete task planning, you can then begin the resource management process and build a team for your project.
Tip 6: Understanding the project communications life cycle. At the heart of Project Server is the cyclical assignment and update process between project managers and team members. Work assignments flow from the project plan to the project resources that perform the work and resources report progress data back to the plan. This communications life cycle flows through the following five steps.
- Project manager publishes the plan to the Project Server database
- Project Server notifies resources of their new task assignments
- Team members update their progress on the project
- Project manager receives and reviews team member task updates
- Project manager publishes the latest project schedule
At any time throughout the project, executives can view the project portfolio of the organization.
Tip 7: Additional communication tools. In addition to the core communication between project managers, project team members, and the leadership team, Project Server provides additional features for communication and collaboration. Some of these features are native to Project Server, others leverage SharePoint. Features native to Project Server include Status Reports, Automated Alerts and Reminders, To Do Lists, Outlook Integration, Task Delegation, and Ad hoc Reporting.
Tip 8: Understanding Windows SharePoint Services (WSS). Each time a new project is saved in the Project Server database, the system optionally provisions a new project workspace on the server running Windows SharePoint Services (WSS). The project workspace contains the WSS services customized specifically for Project Server such as document libraries, issues and risks, lists, discussions and surveys, which users access through the Project Web Access interface.
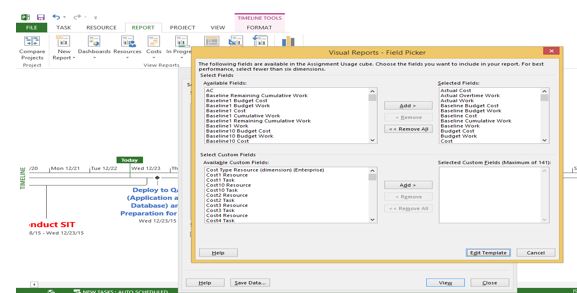
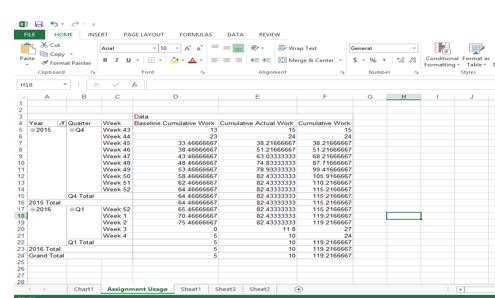
Tip 9: Understanding OLAP. Online Analytic Processing (OLAP) technology relies upon a multidimensional view of data. While relational database structures are two dimensional, OLAP leverages data cubes which contain preprocessed three-dimensional data, time-phased and aggregated by business dimension. Each time Project Server processes the OLAP Cube, it stores the data in a collection of tables labeled with the prefix “msp_cube.”
Tip 10: Portfolio Modeling. Project Server offers a Portfolio Modeler Tool for portfolio analysis that allows you to perform basic what-if analysis for such things as staffing changes in a single project or across a portfolio of projects. This tool can help you improve resource assignments and avoid resource over allocation.