Cara membuat S curve langsung di Microsoft project, how to create s curve by microsoft project 2013

Cara membuat S curve langsung di Microsoft project,

utk konsep s curve: https://thepetshop4u.wordpress.com/2016/05/24/402/


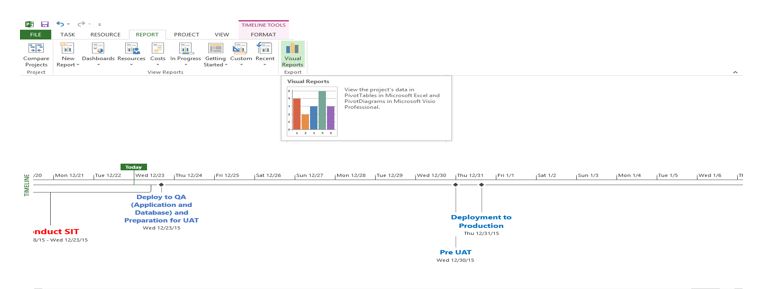
Ini report yg bisa langsung kita generate di MS Project , sumbu y yg dihasilkan adalah waktu  ( week, month ,day) bila yg ingin anda tampilkan percentage, silahkan lihat artikel saya yg satu lagi, khusus s curve percentage. ( http://wp.me/p56ONR-2R )

Yg perlu diingat scruve, adalah compare antara actual dengan plan, tujuannya ingin mengetahui progress project anda yg berjalan saat ini : on schedule, behind schedule atau malah lbh bagus dr schedule:

  1. Plan Diwakili dengan baseline Cumulative work
    1. Yg perlu dilakukan adalah anda harus create baseline dulu, anda bisa lakukan sbb: di menu project-set baseline-set baseline. Baseline yg  anda create pertama adalah nol percentage donenya
  2. Actual disini , diwakili cumulative actual work
    1. Yg perlu dilakukan, setelah anda create baseline seperti diatas, confirmasilah task atau aktifitas yg telah anda lakukan misalnya kick off meeting task done, anda set set 100% , bisa lewat task information-tab general,percent complete

Pada menu reports:

  1. Create a new report., pilih blank dulu saja,
  2. Insert a line graph (menu design, lalu pilih chart) ( pilih yg seperti dibawah, plihan graph harus seperti ini, kl tdk , tdk bisa)

scurve MSproject1


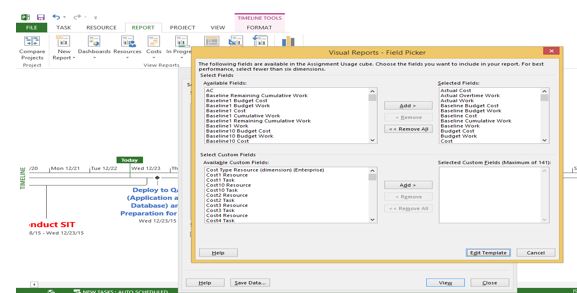
3.Double click graph, muncul field list table , disebelah kanan

Field list, Di work, pilihlah atau Select Cumulative Work ,

Field list, Di work-baseline- pilihlah atau select baseline Cumulative work


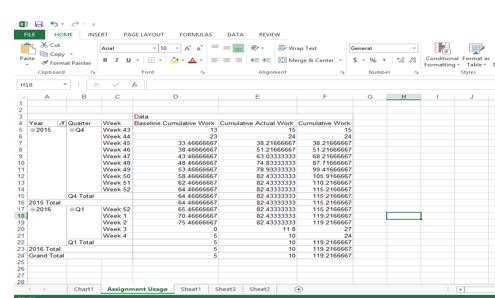
Muncul lah seperti dibawah, anda bisa customize sesuai kebutuhan anda.


scurve MSproject2

Membuat S Curve Percentage dari Microsoft Project , how to create s curve percentages % by microsoft project

S curve tdk bisa dilepaskan dari project management, apa yg menarik dari s curve adalah orang bisa cepat paham saat ini berapa percentage pekerjaan telah dilakukan, baseline/plan seharusnya, apa yg utama dr  scurve juga bisa memberikan awareness ke stakeholder,
posisi saat ini project kita berjalan-bagaimana team bersatu utk on track schedule, ingat dukungan dari executive sangat kita perlukan,
dgn memberikan informasi yg tepat dikemas dlm visual menarik, akan menarik perhatian dan decision cepat.


utk lbh jelas tentang konsep S Curve :https://thepetshop4u.wordpress.com/2016/05/24/402/

asumsi anda sudah familiar dgn ms project, tp jgn khawatir, akan terpisah dijelaskan dari mulai step2 yg sederhana dlm posting terpisah, ( https://thepetshop4u.wordpress.com/2016/01/19/cara-membuat-s-curve-langsung-di-microsoft-project/ )


Menu Report- click Visual reportreport-visual report

 Baseline work report-edit report  Click view (generate excel report)

Edit template, add: Baseline Cumulative work,Cumulative Actual work,Cumulative workEdit template addBaseline Cumulative


Click view (generate  excel report)Baseline work report-edit report

Sheet assignment usageSheet assignment usage


Change data to percentage

Capture


Baseline Cumulative Work:  Baseline Cumulative Work (week awal) /baseline cumulative work (week akhir)
Cumulative Actual Work:  Cumulative Actual Work (week awal) /cumulative work (week akhir)


Cumulative Work : Cumulative  Work (week awal) /cumulative work (week akhir)


Insert chart- line chart type , jadilah s curve, anda bisa atur layout,warna, add data sesuai kebutuhanInsert chart- line chart type

pemilihan chart: chart


Percentage check- % must be same with : menu report-dashboard-work overview ,dibawah hanya contoh tampilan, datanya berbeda dgn diatas,

Percentage check