
S curve tdk bisa dilepaskan dari project management, apa yg menarik dari s curve adalah orang bisa cepat paham saat ini berapa percentage pekerjaan telah dilakukan, baseline/plan seharusnya, apa yg utama dr scurve juga bisa memberikan awareness ke stakeholder,
posisi saat ini project kita berjalan-bagaimana team bersatu utk on track schedule, ingat dukungan dari executive sangat kita perlukan,
dgn memberikan informasi yg tepat dikemas dlm visual menarik, akan menarik perhatian dan decision cepat.
utk lbh jelas tentang konsep S Curve :https://thepetshop4u.wordpress.com/2016/05/24/402/
asumsi anda sudah familiar dgn ms project, tp jgn khawatir, akan terpisah dijelaskan dari mulai step2 yg sederhana dlm posting terpisah, ( https://thepetshop4u.wordpress.com/2016/01/19/cara-membuat-s-curve-langsung-di-microsoft-project/ )
Menu Report- click Visual report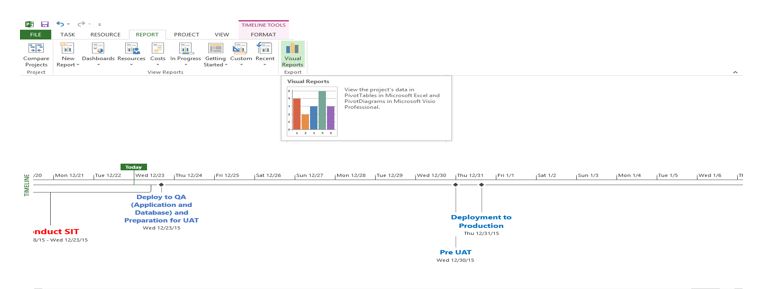
Baseline work report-edit report 
Edit template, add: Baseline Cumulative work,Cumulative Actual work,Cumulative work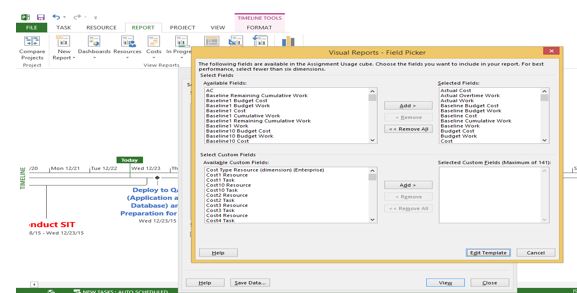
Click view (generate excel report)
Sheet assignment usage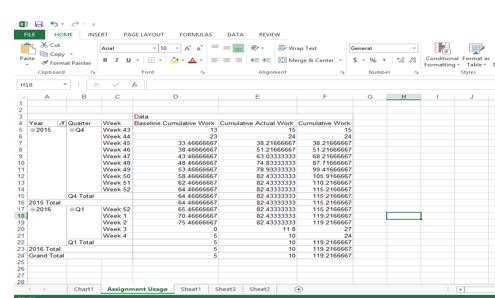
Change data to percentage

Baseline Cumulative Work: Baseline Cumulative Work (week awal) /baseline cumulative work (week akhir)
Cumulative Actual Work: Cumulative Actual Work (week awal) /cumulative work (week akhir)
Cumulative Work : Cumulative Work (week awal) /cumulative work (week akhir)
Insert chart- line chart type , jadilah s curve, anda bisa atur layout,warna, add data sesuai kebutuhan
pemilihan chart: 
Percentage check- % must be same with : menu report-dashboard-work overview ,dibawah hanya contoh tampilan, datanya berbeda dgn diatas,

